Score Interpretation Guide
Methods for Normed Measures
Summarizing the Normed Measure Scale
Because normed measures are baselined using a standard normal curve approach, we can make the following assumptions:
- A score of 50 represents the average for the population defined by the norming context.
- The higher above 50, the more above average the score.
- The lower below 50, the further below average the score.
Examples
- A leader’s earnings call transcript scoring 50 on
big_5.empatheticusing a custom norm based on executive earnings call language would mean the leader comes across as average on empathy compared to peer executives. - A consumer’s concatenated social media posts, analyzed using the Receptiviti Written Norming Context, scores 75 on
drives.risk_seeking. This means the consumer is above average on risk-seeking relative to the general population.
Determining High or Low Normed Scores
Interpreting Normed Scores – Bucket Approach
Since normed measures are baselined using a standard normal curve, we can use a bucketing approach to determine high or low scores relative to the norming context.
This approach categorizes scores based on the number of standard deviations away from the mean. Below, we provide buckets and labels at specific standard deviation and score thresholds.
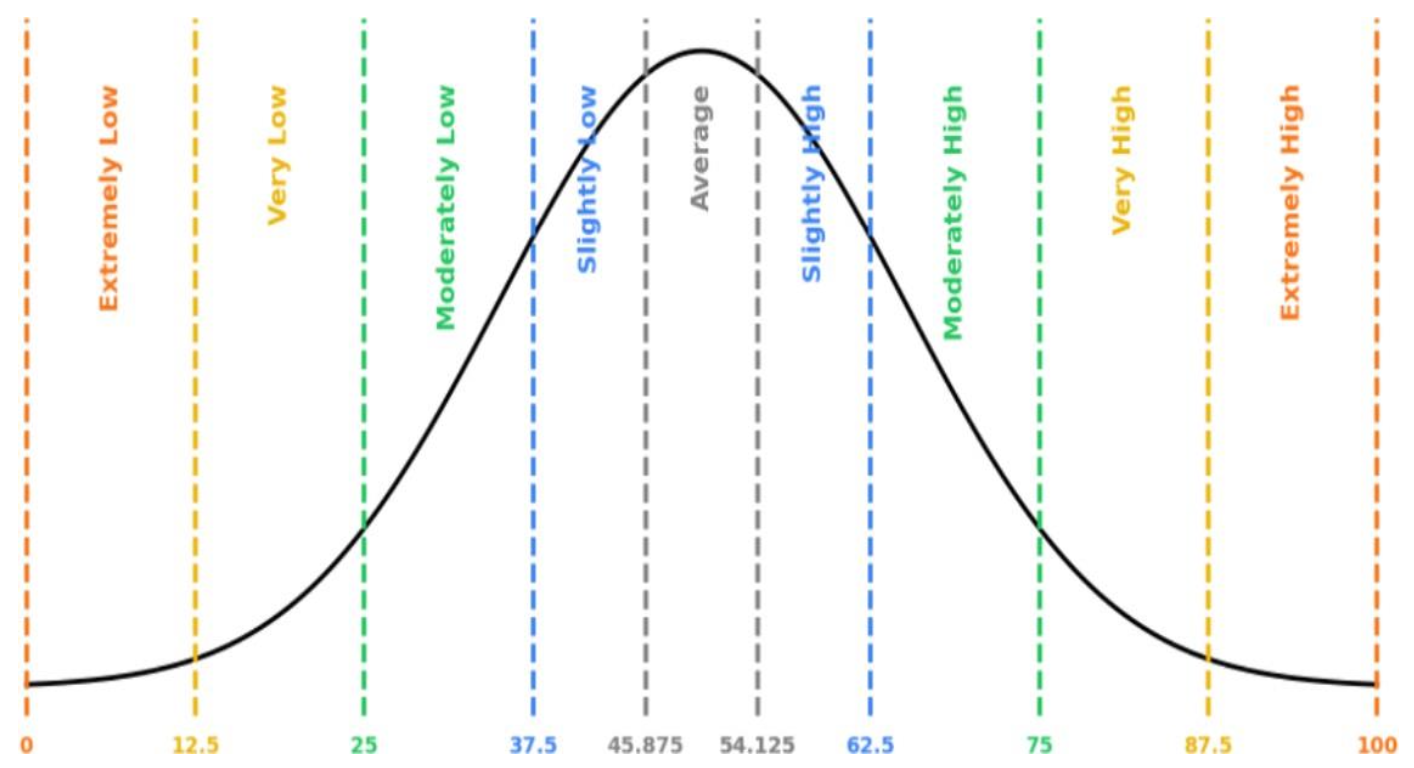
By applying this method, you can quickly identify unusual patterns, track behavioral shifts, and take action when necessary.
| Label | Standard Deviation | Score Upper Bound | Score Lower Bound |
|---|---|---|---|
| Extremely High | Over 3 | 100 | 87.5 |
| Very High | +3 | 87.5 | 75 |
| Moderately High | +2 | 75 | 62.5 |
| Slightly High | +1 | 62.5 | 54.125 |
| Average | +/- 0.33 | 54.125 | 45.875 |
| Slightly Low | -1 | 45.875 | 37.5 |
| Moderately Low | -2 | 37.5 | 25 |
| Very Low | -3 | 25 | 12.5 |
| Extremely Low | Below -3 | 12.5 | 0 |
Standard Deviation = 12.5
The bucket labels and thresholds guide is a general rule of thumb. However, given that each use case is different, it's not the only justifiable way to bucket scores. If you'd like to use different labels or boundaries, or are interested in what is likely the best fit for your cohort, we encourage you to reach out to our sales team at [email protected].
Interpreting Normed Scores – Comparison Approach
Since scores range from 0 to 100, they can be compared to determine what qualifies as a high or low score within a given group.
Example
Two speeches are analyzed using the Receptiviti Spoken Norming Context:
- Speech 1 scores 30 on Big 5 Friendliness.
- Speech 2 scores 10 on Big 5 Friendliness.
Both Speech 1 and Speech 2 come across as less friendly, but Speech 2 is the least friendly of the two.
Methods for Proportional Measures
Understanding Proportional Measures
Unlike normed measures, proportional measures are not baselined. Each measure has a unique mean, variance, and distribution, making it important to reference base rates and standard deviations (either Receptiviti curated or your own).
We can make the following assumptions:
- The higher the score is above the base rate, the higher it is relative to the context the base rate was derived from.
- The lower the score is below the base rate, the lower it is relative to the context the base rate was derived from.
Interpreting Proportional Scores – Comparison Approach
Since proportional scores range from 0 to 1 (or -1 to 1 if Sentiment), they can be compared within a given sample group to determine relative differences.
Example
Two pieces of marketing ad copy are analyzed using LIWC’s Analytical Thinking measure:
- Ad 1 scores 0.71.
- Ad 2 scores 0.30.
Ad 1 comes across as more analytical than Ad 2.
Regarding Calculating Percentile Using Z-score
When you compute a percentile from the z-score values supplied by our API, the result will differ slightly from the rank-normed percentile scores generated directly by the API (if that output format is enabled and specified in the query parameters). This is because our API (when using the rank-based norming method) provides the actual raw percentile based on the data in the norming dataset (i.e., the percentage of observations at or below the current score), without assuming a perfectly normal distribution. While the raw scores of our measures do fall into normal-shaped distributions, there will be slight variations from a perfect standard normal curve based on your choice of norming dataset.
We default to the standard normal curve/z-score norming method, as we find that most people naturally interpret behaviour through the lens of a normal distribution. This also better reflects the way many traits are naturally distributed. In other words, most people fall near the average on a given trait, and it usually takes a truly extreme example for someone to be perceived as extreme or an outlier on something (e.g., even very extraverted individuals are rarely viewed as truly having fringe-level or unusual levels of extraversion.) Percentile scores can be very helpful if your goal is to understand rank rather than perception.
Please reach out to [email protected] if you would like the ability to adjust your output from default z-scoring to rank normed percentiles. Once we enable rank-based norming on your account, this method can be requested by including an additional query parameter in each API call.